Bayesian networks
IRIS Wiki - Computational Models - Bayesian networks
Contents
Background
A Bayesian Network (also called Bayesian belief network, belief network, Bayesian net, BBN, BN or graphical probability model) is a model for reasoning about uncertainty. Founded on the centuries-old Bayesian probability theory (invented by Thomas Bayes in 1763), the subject has been given a new lease on life in recent years due to advances in algorithms and theory. These advances mean that it is now possible to build and run realistic Bayesian nets for a wide range of applications.
Description
A Bayesian belief net (BBN) is a directed graph, together with an associated set of probability tables. The graph consists of nodes and arcs as shown below. The nodes represent variables, which can be discrete or continuous. For example, the node 'faults in test/review' is discrete having values 0,1,2,.., whereas the node 'system safety' might be continuous (such as the probability of failure on demand). The arcs represent causal/influential relationships between variables.
Formally, Bayesian networks are directed acyclic graphs whose nodes represent variables, and whose missing edges encode conditional independencies between the variables. Nodes represent random variables, but in the Bayesian sense: they may be observable quantities, latent variables, unknown parameters or hypotheses. Efficient algorithms exist that perform inference and learning in Bayesian networks. Bayesian networks that model sequences of variables (e.g. speech signals or protein sequences) are called dynamic Bayesian networks. Generalizations of Bayesian networks that can represent and solve decision problems under uncertainty are called influence diagrams.
Given a situation where it might rain today, and might rain tomorrow, what is the probability that it will rain on both days? Rain on two consecutive days are not independent events with isolated probabilities. If it rains on one day, it is more likely to rain the next. Solving such a problem involves determining the chances that it will rain today, and then determining the chance that it will rain tomorrow conditional on the probability that it will rain today. These are known as "joint probabilities." Suppose that P(rain today) = 0.20 and P(rain tomorrow given that it rains today) = 0.70. The probability of such joint events is determined by: P(E1, E2) = P(E1)P(E2|E1)
Working out the joint probabilities for all eventualities, the results can be expressed in a table format:
                                      Rain Tomorrow No Rain Tomorrow MarginalProbability of Rain Today
Rain Today                            0.14          0.06             0.20
No Rain Today                         0.16          0.64             0.80
Marginal Probability of Rain Tomorrow 0.30          0.70
From the table, it is apparent that the joint probability of rain over both days is 0.14, but there is a great deal of other information that had to be brought into the calculations before such a determination was possible. With only two discrete, binary variables, four calculations were required.
This same scenario can be expressed using a Bayesian Network Diagram as
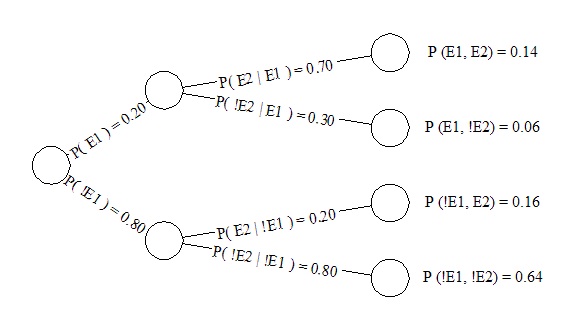 ("!" is used to denote "not").

Application to Interactive Storytelling
U-Director is based on bayesians networks.
Examples
-
References
- Niedermayer, D. (1998). An Introduction to Bayesian Networks and their Contemporary Applications[1]
- Murphy, K. (1998). A Brief Introduction to Graphical Models and Bayesian Networks[2]
- Flavia Sparacino, Sto(ry)chastics: A Bayesian Network Architecture for User Modeling and Computational Storytelling for Interactive Spaces, UbiComp 2003, LNCS 2864, pp. 54–72, 2003
- Bangsø, O.,Jensen, O.G., Jensen, F.V., Andersen, P.B. and Kocka, T. (2004). Non-linear interactive storytelling using object oriented bayesian networks. In Proceedings of the International Conference on Computer Games: Artificial Intelligence, Design and Education.